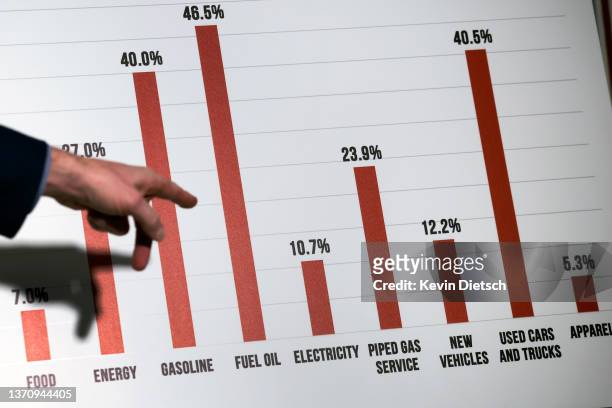
Sen. Todd Young references a chart on rising costs during a press conference on inflation, at the Russell Senate Office Building on February 16, 2022...
Staff member stands in a projection of live data feeds from Twitter, Instagram and Transport for London by data visualisation studio Tekja at the Big...
An investor views the stock index at a securities company on May 30, 2007 in Nanjing, China. The Shanghai Composite Index fell by 6.5% today, after...
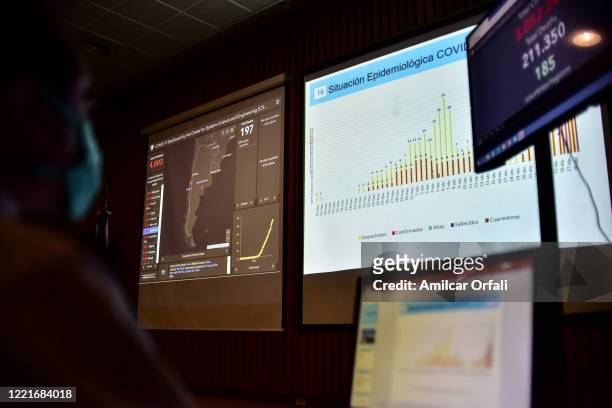
Doctor wearing a face mask checks monitors with real time data of the COVID-19 outbreak at Central Navy Hospital Dr. Pedro Mallo on April 28, 2020 in...
Trader looks on in front of a chart showing the downward trend of the Dow Jones Industrial Average at the New York Stock Exchange at the end of the...
Visitor watches a digital video display at a big data industrial park on May 29, 2021 in Tai an, Shandong Province of China.
Trader looks over computer monitors showing financial data on the floor of the New York Stock Exchange July 24, 2008 in New York City. Stocks...
An employee walks at an exhibition hall for the Chongqing New Type Internet of Things Big Data Service Platform for Digital Transportation at a...
Stick navigation chart made from bamboo and cowrie shells, Marshall Islands, wood, twine, cowrie shells, bamboo, straw, 1999.65.60.
Visitors check out an infinity chamber seeking to reproduce the atmosphere of a large data centre at the "Futurium", House of Futures in Berlin after...
Centers for Disease Control laboratorian at the laboratory, analyzing data on a computer, 1975. Image courtesy Centers for Disease Control.
John Dalton's table of elements of 1803 illustrating his atomic theory. The atoms of different elements were represented by symbols and their...
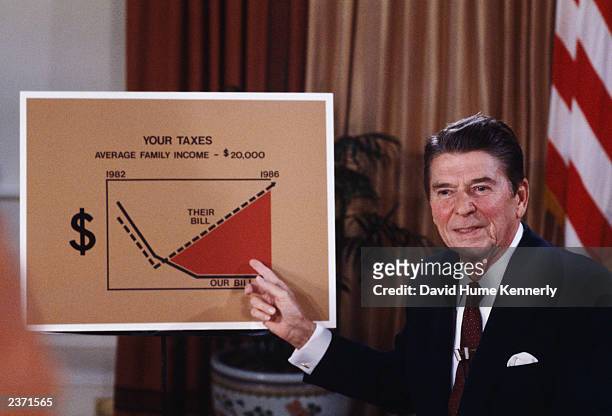
Washington: President Reagan, with the use of charts, illustrates his attempts to compromise with Congress, on the 1983 budget. Reagan appeared in a...
Elinor Mantin shops for groceries at Lorenzo's Supermarket as a new government report showed that consumer prices rose last month February 20, 2008...
Actor Brent Spiner plays Commander Data, Science Officer, on the hit TV show "Star Trek: The Next Generation." The series aired in 1987 and ran to...
President Ronald Reagan addresses the nation from the Oval Office on Tax Reduction Legislation July 27, 1981 in Washington, DC.
Astronomical chart showing a winged virgin holding wheat in her left hand and a lily in her right hand forming the constellation.
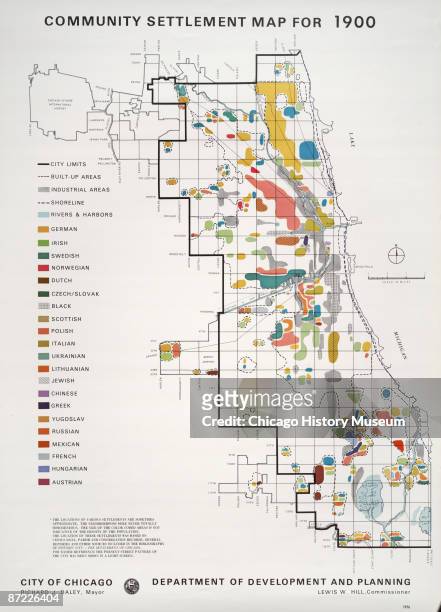
Community settlement map for the year 1900 shows Chicago to be a multi-ethnic and biracial crossroads. Published by the City of Chicago Department of...
Statistical chart showing economic and social conditions in Britain over the first three years of World War II, from September 1939 to September...
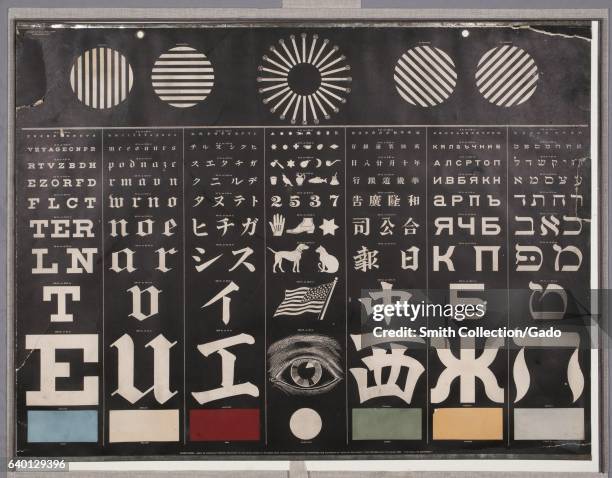
Chart by George Mayerle for the purpose of testing vision, 1907. Courtesy National Library of Medicine. .
Here a number of CDC personnel analyze field data in order to formulate an epidemiologic plan of action, 1945. Photograph of a group discussion...
Two commodities traders consider a graph of futures productivity; screen print from a photograph, 1937.
Office workers entering data with tabulating machines and punch cards at the Erie Railroad Company offices, Cleveland, Ohio, January 22, 1958.
Illustrated chart from the magazine 'The Fireside Monthly' shows 'The deaf mute alphabet, with one hand' now known as sign language or visible...
The above chart, issued by the Bureau of the Budget, shows Uncle Sam's expenditures and income for the past two fiscal years, 1953 and 1954 and for...
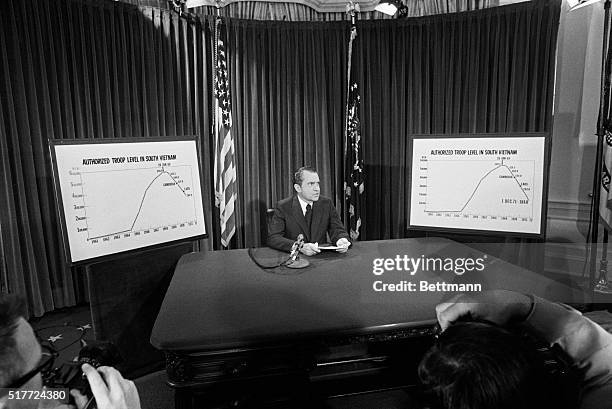
President Nixon is flanked by chart he used to illustrate his televised speech from the White House 4/7 in which he announced he will withdraw an...
An instructional illustration of a juggler performing one-pin maneuvers with diagrams of the stages of the maneuvers.
Chart shows how pilotless, radio-controlled planes and landing craft will be used to gather scientific data during the forthcoming atom bomb test at...
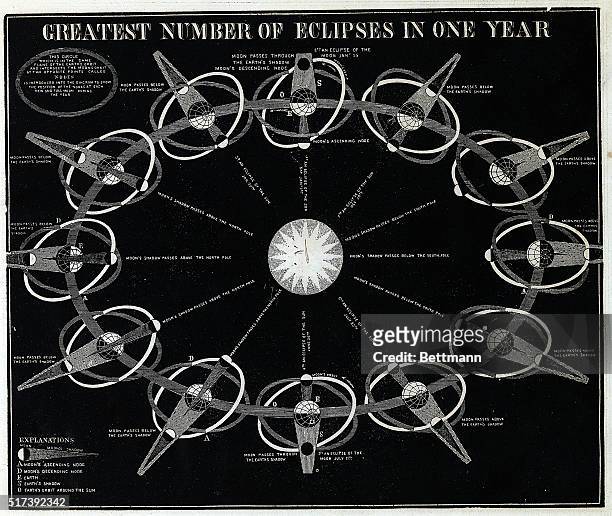
Illustrated chart shows the the relation of the earth, moon and the sun within the cycle of the "The Greatest Number of Eclipses in One Year."...
Washington, DC- Treasury Secretary John Snyder, left, shown with Chairman Robert L. Doughton, of the House Ways and Means Committee, proposed to...
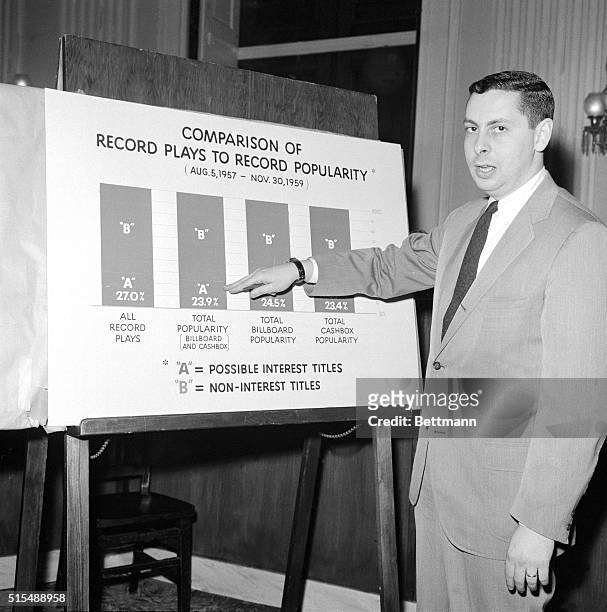
Bernard Goldstein, Vice President of the New York City firm of Computech, INC., uses a chart as he tells House Payola Investigators that 27% of the...
Washington: Past chairman of the Council of Economic Advisers testify before the Senate Banking Committee on anti-inflation policies. Left to right...
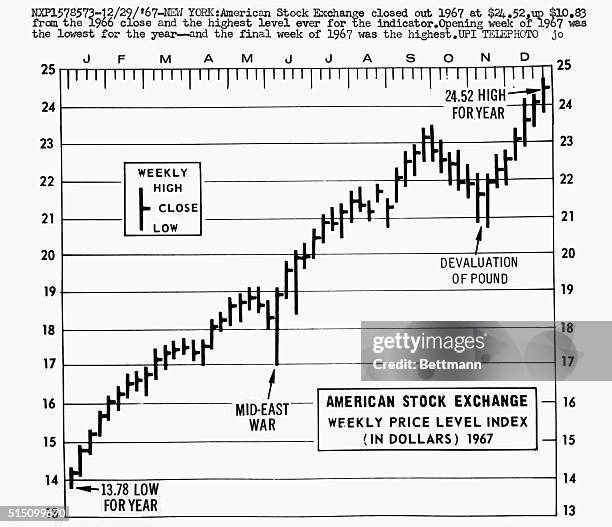
New York: American Stock Exchange closed out 1967 at $24 up $10.83 from the 1966 close and the highest level ever for the indicator. Opening week of...
View of a stack of data tapes, all marked 'Secret,' as well as computers and an unidentified operator, at the North American Air Defense Command...
Worker assembles a data center module container at the Rittal stand at the 2013 CeBIT technology trade fair the day before the fair opens to visitors...
This illustration photo taken in Los Angeles on April 6, 2021 shows a person looking at the app for the New York State Excelsior Pass, which provides...
Portolan chart of the Mediterranean Sea, the Black Sea, Sea of Azov and Atlantic coasts of Europe and Africa, 16th century. Found in the Collection...
Signage with logo at the Silicon Valley headquarters of data center operator Digital Realty, with reflection of man walking towards door of the...
Director Health & Human Resources Richard Schweiker pointing to charts showing allocations of Federal Budget to his department.
Diagrams showing the causes of mortality in British Army during Crimean War in "Contribution to the sanitary history of the British Army during the...
Life size chromolithographic anatomical chart consisting of basic image of superimposed multiple series of hinged flaps illustrating tissue groups,...
Two images of the human body; the left page presents the frontal view of the skeletal system and the right page shows the back view of the muscular...
Milton J. Fayne, meteorologist at the New York Weather Bureau, scans a large number of weather charts to get a line on the activities of Hurricane...
This chart gives the extent of the damage to homes in London during the war. To house her millions of fighting men returning from all over the world,...
Boston, Mass.: WAC's at a Boston Port of Embarkation work on secret data preparatory to troop movements.
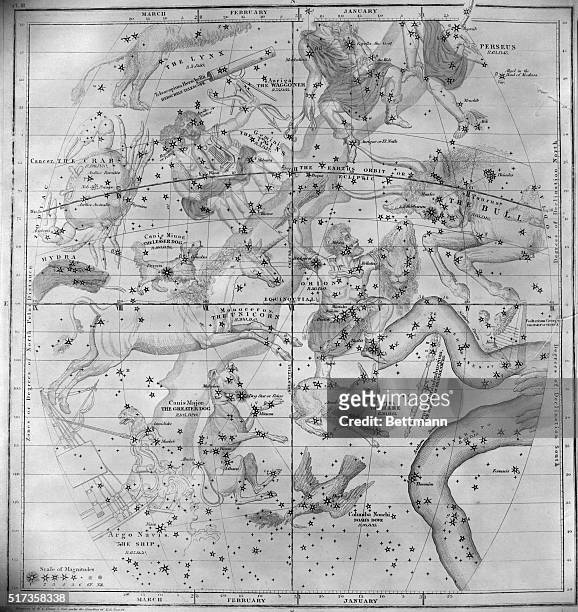
Chart of the heavens with constellations between Cancer and Taurus, including the Unicorn, and Orion. Undated illustration.
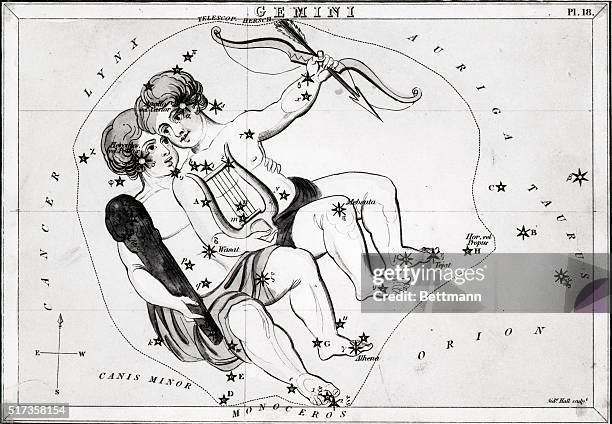
Engraving of A View of the Heavens showing the constellation Gemini, the Twins. The Twins are shown as children, one holds a club, one holds a bow...
Chart compiled for use at the Interstate Conference on Automotive Taxation held in New York City recently, showing how the tax gathered on gasoline,...
The UNIVAC 1832 Multiprocessor computer performs a multitude of data processing functions as the key element in the avionics system installed aboard...
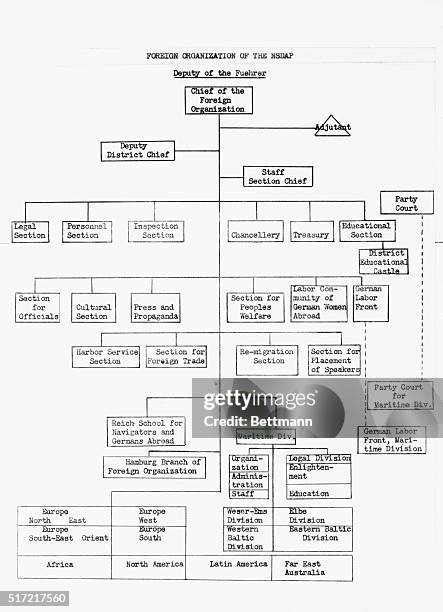
Attorney General Francis Biddle revealed in Washington, D.C., on November 27, 1941 that this chart is a detailed blueprint for the organization of...
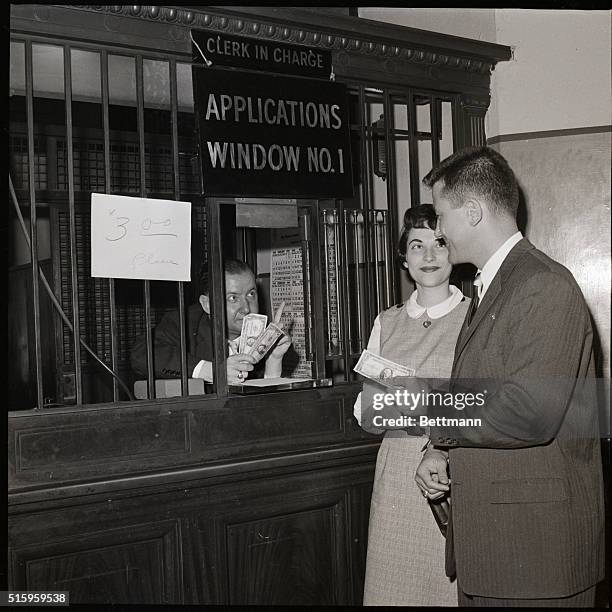
New York, New York- Asking for another dollar, clerk George Whitfield reminds prospective bridegroom William Aronson that the marriage license fee...
Washington, DC- President Bush points to a chart indicating job growth during an Oval Offfice meeting with Michael Boskin, Chairman of the council of...
San Francisco, CA- A seismologist at the California Academy of Sciences points to the high-point of the earthquake that hit southern Peru 9/3. The...
In the maddest buying stampede since 1927 stocks and commodities soared to new high prices for the year in Wall Street, April 20th as the financial...